Skip to content

EFFICIENT AND
SELF-SUFFICIENT

We help COOs and Operations leaders reduce average-handling-times by up to 75%—by eliminating waste and improving flow - creating a continuous improvement culture that drives better outcomes at lower cost.

Symptoms

ALL COMPANIES
GET STUCK

A broken process is not just an operational inconvenience; it’s a virus in the bloodstream of your business. Most pay little attention to it - they ignore it, accept it, make excuses for it or add it to the backlog for the future - but as it spreads, it drains energy, consumes resources, and eventually takes control, moving far-beyond the system where it started, infecting teams, timelines, customers, and profit margins.

1
Symptom 1
Processes are broken, hindered by manual effort, duplication, and workarounds.
2
Symptom 2
Teams are firefighting backlogs and overtime costs are stacking higher by the day.
3
Symptom 3
You're drowning in rework, complaints, and firefighting, solving problems that shouldn't exist.
4
Symptoms 4
Rapid growth is exposing inefficiencies, and what used to work, no longer scales.
5
Symptom 5
Human error is creeping in, and you’re relying on individuals instead of system automation.
6
Symptom 6
Multiple teams trying to solving the same problems differently, with no consistent way to improve.
7
Symptom 7
Great ideas for improvement exist, but they never get tracked, prioritised, or actioned.
8
Symptom 8
You're ready to explore what automation and AI could do to help, but you're not sure where to start.
Show more
Sound Familiar?

WHY IT MATTERS

Flow
Because fixing broken processes improves flow, and flow improves quality and saves time and money.
Scalability
Because what works for 100 customers won’t work for 1,000, scalable operations don’t survive by accident.
Culture
Because when you build a culture where your people care, inefficiency has nowhere to hide.
Process Desktop

Tip Of The Iceberg

A process isn’t broken just because it’s slow, inefficient, or frustrating. It’s broken when it no longer serves its intended purpose.
Ready to talk?
Benefits &

OUTCOMES

Most leaders think they see the cost of inefficiency; rework, backlogs, delays, overtime, customer complaints and so on. But these are just the symptoms. Fix the root causes, and the real benefits start to show:

AHTsWhite
IMPROVE FLOW
Reduce average handling times by up to 50% by streamlining broken, manual workflows.
Down IconWhite
REDUCED COSTS
Reduce operating costs by up to 30%: obliterate waste, and automate repetitive tasks.
Right First Time IconWhite
RIGHT FIRST TIME
Eliminate errors and rework by removing opportunities for defects and failure.
C-SAT iconWhite
IMPROVE C-SAT
Reduce the delays that cause complaints: Improve speed, accuracy and experience.
The biggest threat to your business isn’t competition, regulation, or even inflation - it’s inefficient, broken manual processes, because you think the cost is X, but it’s actually 10X.

HOW WE WORK

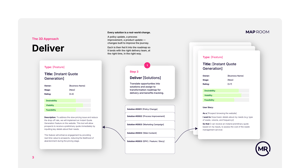
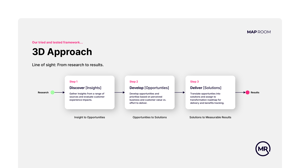
Get to know our tried and tested framework.

Direction.
Then Design.
It starts by defining the outcomes that matter. Clear objectives and measurable key results that bring laser-focus to how we'll measure success.
And with the vision of the future locked in, we can engineer the change to deliver it.
OKR Image
3D Approach Image-1
The 3D
Approach.
A service design-led framework to move from insight to impact — fast. We uncover friction, identify the moments that matter, and co-design better ways to serve your customers and your business.
Grounded in reality. Research-led. Experimentation-first. We learn fast, test early, and shape solutions that transform your business.
1: Discover
Insights.
We capture insights from a range of internal and external sources — structured to surface patterns, pains and needs that identify where change matters most.
And with the truth on the table, we can start turning pain into profitable potential.
Discover Image-1
Develop Image2
2: Develop
Opportunities.
Translate insight into action, framing opportunities that are measurable, prioritised, and rooted in what matters most to customers and the business.
Each one is ranked by value and effort, helping focus energy on ideas that deliver the best return.
Value
vs. Effort.
Not every opportunity is equal.
We score opportunities based on what improves experience, what drives revenue, and what’s worth the time it’ll take. That’s how we focus on what matters, and drop what doesn’t.
Value-Effort Image-1
Deliver Image
3: Deliver
Solutions.
We shape each solution to fit the need — policy changes, campaigns, new content, process improvements, system config, or a product feature — whatever it takes to deliver the impact.
Solutions are then scheduled on the backlog for delivery.
Research
to Results.
Unfortunately, you can't fix everything all at once. But you can choose to focus on the things that matter - to you, your business, your colleagues and, importantly, your customers.
Our 3D Approach is simple, structured, and designed to deliver progress you can measure.
Research to Results-1
Show more
JOUNREY 2 3D DESKTOP

See Your
Processes in 3D

Define. Design. Deliver.
Transform resource-draining, forgotten broken processes and workflows, where spreadsheets and human error slow growth and eat into margins.

CURIOUS?

Here’s what people usually want to know.

How do you identify inefficiencies?

We start by listening — to your people, your processes, your data, and your customers. We draw on a mix of internal and external sources: operational data, backlog volumes, failure rates, customer feedback, journey analytics, interviews, and frontline insight. Then we structure that information into clear insights — behaviours, pain points, patterns, and needs — layered across end-to-end processes.

We look for the processes under the most pressure (high volume, high failure demand, low flow), and the ones with the most automation potential — typically manual, repetitive, rules-based, and consistent in how they're executed.

This gives us the full picture: where things are breaking, where effort’s being wasted, and where smarter design or automation could make the biggest impact.

From there, we shape the opportunities — using our signature method — to prioritise what gets done first and how it's delivered. You can learn more about that on the ‘What We Do’ page.

How do you measure success?

We believe success should be visible—and measurable. That might mean reducing operating costs, improving flow times, boosting adoption, or hitting compliance targets. We agree the right metrics upfront and hold ourselves accountable to them from start to finish.

For our Process Improvement service, success is typically defined by average-handling-times, quality, customer experience, and of course, operating costs.

With the right insight, design, and support for change, backlogs clear, manual effort reduces, and the material business value emerges—performance, efficiency, and measurable cost-savings.

What size businesses do you usually work with?

We typically work with mid-sized to large organisations, often with multiple service lines, complex operations, and significant regulatory or growth pressures. That said, our approach scales up or down depending on the challenge. Whether you're tackling a specific pain point or transforming end-to-end, we meet you where you are.

What industries do you work with?

Answer Goes Here!

More detail can go here - Lorem ipsum dolor sit amet, consectetur adipiscing elit, sed do eiusmod tempor incididunt ut labore et dolore magna aliqua. Ut enim ad minim veniam, quis nostrud exercitation ullamco laboris nisi ut aliquip ex ea commodo consequat.

PROCESS SCROLL DESKTOP

You've
Scrolled This Far

That usually means something resonated.
Ready for a conversation?
Map Room Primary Logomark White on Transparent Sized-Jun-27-2025-01-33-52-3195-PM
EFFICIENT AND
SELF-SUFFICIENT

We help COOs and Operations leaders reduce average-handling-times by up to 75%—by eliminating waste and improving flow - creating a continuous improvement culture that drives better outcomes at lower cost.