Skip to content

OPERATING
COSTS REDUCED

We help COOs and transformation leaders reduce operating costs by up to 30% by redesigning their operating model—creating a leaner, faster operation, fit for future growth.

Symptoms

ALL COMPANIES
GET STUCK

If it feels like you’re spending more to get the same results, you’re not imagining it. The team’s bigger. The costs are higher. The pace is slower. What’s left are systemic and structural problems, and theyre buried in your org design, spend profile, and ways of working. These are the symptoms we see most often:

1
Symptom 1
Your operating model has become bloated, and the cost of complexity is adding up.
2
Symptom 2
Your costs are rising fast, and you're unsure which strategic levers will make a difference.
3
Symptom 3
Managerial spans of control have drifted, and layers of leadership are slowing things down.
4
Symptoms 4
You have a top-heavy structure that no longer matches what the business really needs.
5
Symptom 5
Your reliance on external support is growing, and you want to build internal capability instead.
6
Symptom 6
Your teams are wasting hours on inefficient, manual processes that add little value.
7
Symptom 7
Your “catch-all, check-all” culture is burning through resource without delivering better outcomes.
8
Symptom 8
You’re hiring into high-cost locations, even when deeper talent pools exist elsewhere.
Show more
Sound Familiar?

WHY IT MATTERS

Control
Because strategic cost reduction creates control [not chaos].
Efficiency
Because a well-designed business runs faster, cheaper, and better.
Scalability
Because leaner operations scale faster [without the growing pains].
CAR BONNET - DESKTOP

Pop The Bonnet On
Your Operating Model.

Most businesses don’t need a bigger engine, they just need to stop leaking value from the one they've already got...
Benefits &

OUTCOMES

Fewer layers. Lower spend. Faster pace. These are the outcomes we help our customers unlock by reengineering their operation:

Down IconWhite
LOWER COSTS
Up to 30% cost reduction through smarter structures, processes, and reduced spend.
AHTsWhite
REDUCED AHTs
Reduce waste and cut average-handling-times on key processes by up to 50%.
ContractorsWhite
REDUCED SPEND
Reduce contractor spend by up to 40%, without sacrificing performance.
FlowWhite
SIMPLIFIED OD
Flatten leadership layers, tighten spans of control, and eliminate duplication to improve flow.
The primary objective of operations is flow. When work moves freely, cost comes down, quality goes up, and teams perform at their best.

HOW WE WORK

Get to know our tried and tested framework.

Direction.
Then Design.
It starts by defining the outcomes that matter. Clear objectives and measurable key results that bring laser-focus to how we'll measure success.
And with the vision of the future locked in, we can engineer the change to deliver it.
OKR Image
3D Approach Image-1
The 3D
Approach.
A service design-led framework to move from insight to impact — fast. We uncover friction, identify the moments that matter, and co-design better ways to serve your customers and your business.
Grounded in reality. Research-led. Experimentation-first. We learn fast, test early, and shape solutions that transform your business.
1: Discover
Insights.
We capture insights from a range of internal and external sources — structured to surface patterns, pains and needs that identify where change matters most.
And with the truth on the table, we can start turning pain into profitable potential.
Discover Image-1
Develop Image2
2: Develop
Opportunities.
Translate insight into action, framing opportunities that are measurable, prioritised, and rooted in what matters most to customers and the business.
Each one is ranked by value and effort, helping focus energy on ideas that deliver the best return.
Value
vs. Effort.
Not every opportunity is equal.
We score opportunities based on what improves experience, what drives revenue, and what’s worth the time it’ll take. That’s how we focus on what matters, and drop what doesn’t.
Value-Effort Image-1
Deliver Image
3: Deliver
Solutions.
We shape each solution to fit the need — policy changes, campaigns, new content, process improvements, system config, or a product feature — whatever it takes to deliver the impact.
Solutions are then scheduled on the backlog for delivery.
Research
to Results.
Unfortunately, you can't fix everything all at once. But you can choose to focus on the things that matter - to you, your business, your colleagues and, importantly, your customers.
Our 3D Approach is simple, structured, and designed to deliver progress you can measure.
Research to Results-1
Show more
FIREMAN - DESKTOP

See Your
Operation in 3D

Define. Design. Deliver.
Forget firefighting. Let friction fade.

CURIOUS?

Here’s what people usually want to know.

Where do most cost savings come from?

It starts with identifying the strategic levers you can pull. That might mean consolidating processes and teams, leveraging central support functions, removing waste (whether that’s through automation, elimination, or simplification), or restructuring to reduce top-heavy layers. Sometimes it’s about creating Centres of Excellence, standardising spans of control, or rethinking recruitment and location strategy altogether.

We use our own signature method to step through these areas methodically — co-designing the future state with you and identifying any necessary transition states along the way.

And, when combined with our Change Management support (which we always recommend), we don’t just leave you with a blueprint — we help you deliver it in the right way, with the right comms, and with stakeholder readiness, and adoption built in from the start.

How do you identify inefficiencies?

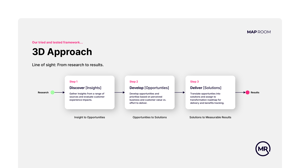
We start by listening — to your people, your processes, your data, and your customers. We draw on a mix of internal and external sources: operational data, backlog volumes, failure rates, customer feedback, journey analytics, interviews, and frontline insight. Then we structure that information into clear insights — behaviours, pain points, patterns, and needs — layered across end-to-end processes.

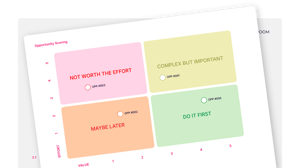
We look for the processes under the most pressure (high volume, high failure demand, low flow), and the ones with the most automation potential — typically manual, repetitive, rules-based, and consistent in how they're executed.

This gives us the full picture: where things are breaking, where effort’s being wasted, and where smarter design or automation could make the biggest impact.

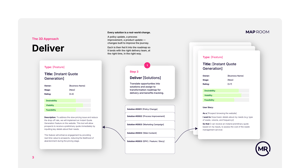
From there, we shape the opportunities — using our signature method — to prioritise what gets done first and how it's delivered. You can learn more about that on the ‘What We Do’ page.

What industries do you work with?
We work with organisations in fast-moving, regulated industries including:
  • Financial Services
  • Digital Banking
  • Utilities
  • Gambling
  • And other customer-critical service industries
These are sectors where customer experience, compliance, and operational performance need to be tightly aligned, and where the cost of inefficiency is high.
What size businesses do you usually work with?

We typically work with mid-sized to large organisations, often with multiple service lines, complex operations, and significant regulatory or growth pressures. That said, our approach scales up or down depending on the challenge. Whether you're tackling a specific pain point or transforming end-to-end, we meet you where you are.

SCROLL  DESKTOP

You've
Scrolled This Far

That usually means something resonated.
Ready for a conversation?
Map Room Primary Logomark White on Transparent Sized-Jun-27-2025-01-33-52-3195-PM
OPERATING
COSTS REDUCED

We help COOs and transformation leaders reduce operating costs by up to 30% by redesigning their operating model—creating a leaner, faster operation, fit for future growth.